 Inspired by the partitioning problem I set about to implement a well known algorithm, k-means clustering, from memory, for fun! ... and, for science... Interestingly, this is somehow the opposite of the partitioning problem. In the partitioning problem we tried to maximize variation of categorical variables within groups, whereas here we're trying to find groups of elements that are the most "similar" to each other in a n-dimensional continuous space.
The main idea of k-means is the following - if you have a bunch of elements and a given number of clusters:
- Create the initial clusters randomly within the space spanned by the elements (typically (always?) you would pick randomly from your elements).
- Lob all elements into the cluster with the nearest center (using some Euclidean distance metric typically).
- Recenter each cluster on the average of its elements,
- If necessary move the elements to their now nearest clusters.
- Repeat the "re-centering" and moving of elements until we have a "stable" (enough) result.
First I implemented some simple data structures, Points:
I use the snazzy method missing as a way to reference named dimensions of points easily, e.g. point.x and point.y (or point.z, point.t, point.w1, point.hausdorff, or point.scary).
Clusters are simply:
The definition of "moved" was the first design choice I could not remember entirely - is it when a certain number of points "jump" from a cluster to another or when the cluster center moves more than a certain distance? (Most of the time I would assume this boils down to the same.) I went for the latter. The clusters themselves keep track of if they have moved or not.
I also implemented a special case of points, 2D points:
Last helper method in here is simply to plot these clusters (in 2D), and I use gnuplot like so:
The real meat is in the k-means method itself of course:
This takes as parameters the points themselves (as an Enumerable of Points), the number of clusters (k), the delta (defines what is a "move"), and if we want to plot each iteration. (Especially interesting while debugging the algorithm... :-)) No real surprises here, I guess. I chose to delete clusters with no points. I'm not entirely sure if that is what's in the original algorithm. (I guess by now I should duckduckgo it. :-))
Then I created a very silly little script that generates 10000 random points in 2D and (tries to) put them into 7 clusters, gnuplot'ing each iteration, to test the algorithm.
Voila, the results are in:
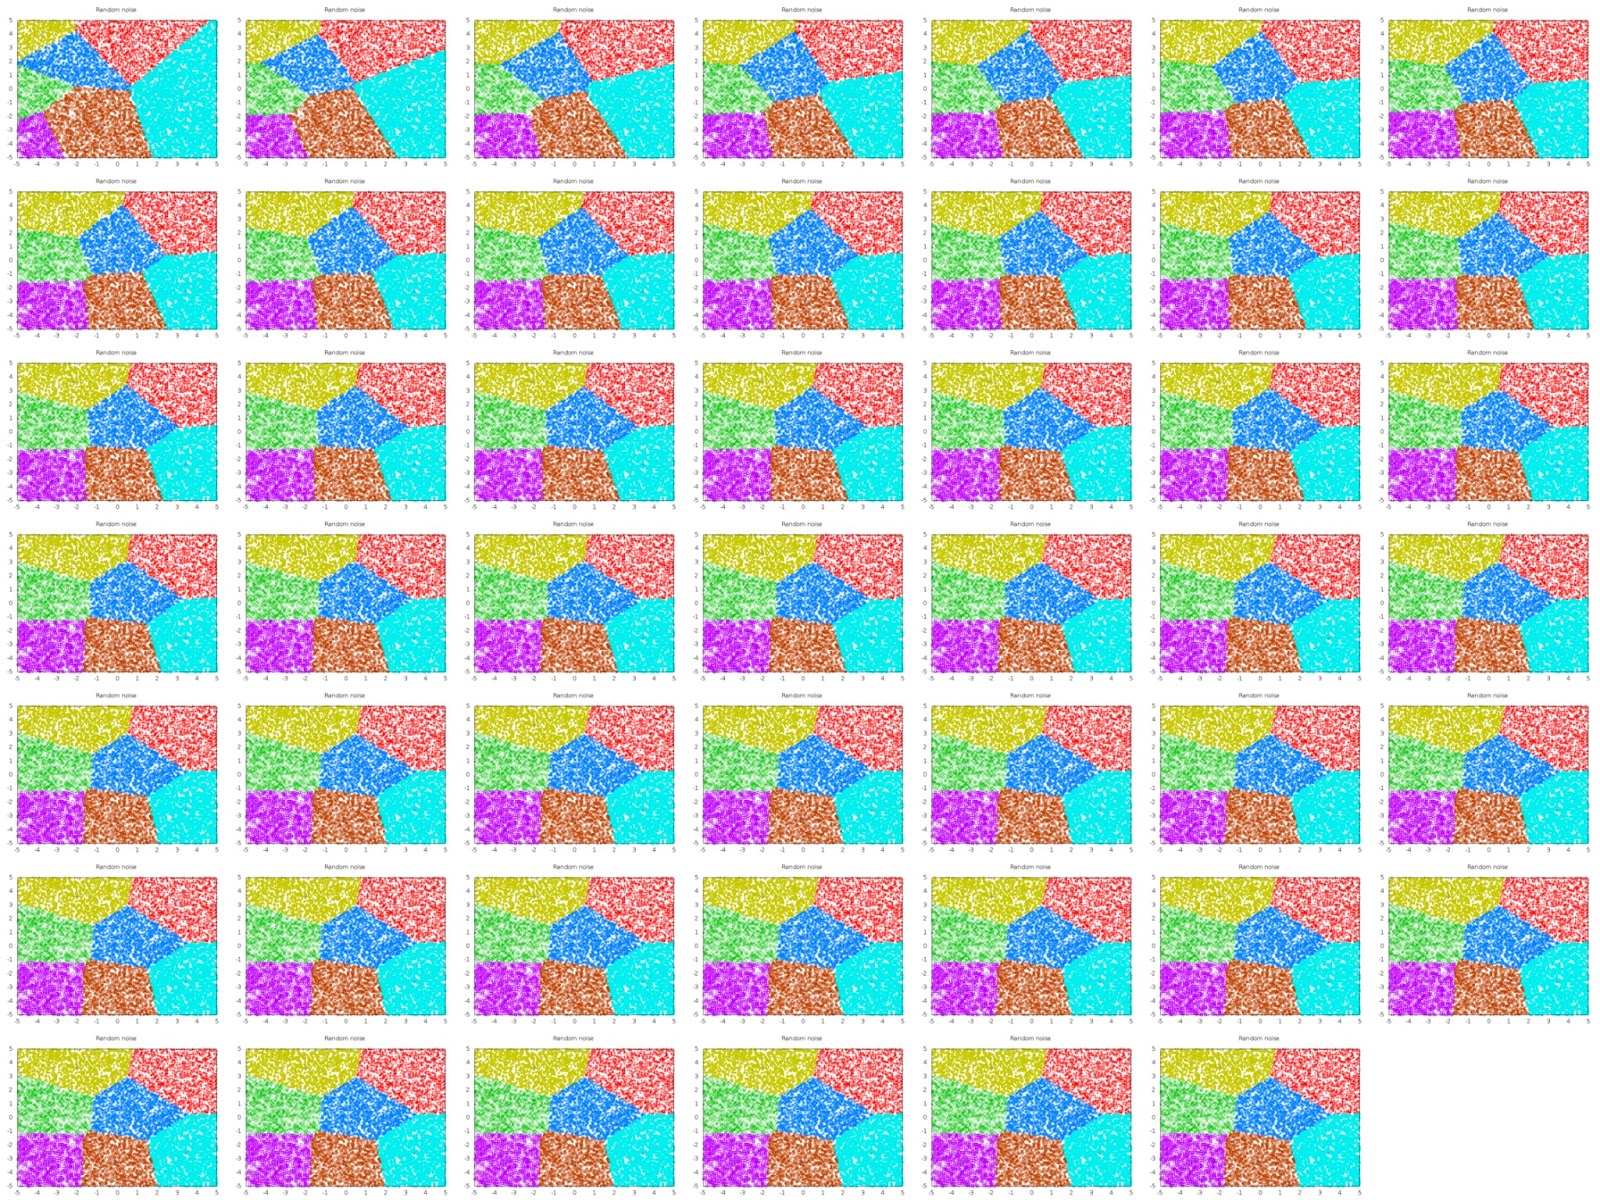 |
| montage -geometry "320"x"240" -tile 7x7 outfiles/clusters-7* clusters-all.png |
 |
| convert outfiles/clusters-7* clusters-all.gif |
Epiolog
I guess a variant of this could serve as a solution to the partitioning problem if we just map the categorical variables to the continuous space (using the weights?) and sample one element from each resulting (population/number of groups + 1) cluster (where the cluster size would be locked - Lloyd's algorithm?) to form groups.
Moral
It is useful to (try to) implement an algorithm you think you know from scratch from time time to see if you really do know all the details in the implementation of it... Especially in new languages.
Update: Clone this github if you for any reason would want to play around with this yourself: https://github.com/mortenjohs/k-means...